
Introduction
In the clinical trial industry, there’s a persistent challenge that researchers confront – missing data. Patients might drop out unexpectedly, compliance can wane, and technical hiccups can occur. Addressing this issue isn’t just a matter of convenience; it’s a critical step in ensuring the accuracy and reliability of the study results.
Background
No dataset is perfect, and missingness is common in clinical trials. There are various reasons that may lead investigators to perform data imputation: Statistical power takes a hit if missing values are removed; Ignoring missing data can bias the results if missingness is informative; Data imputations restores the sample size and reduces biasness; Making the best use of the costly collected data. What’s arguably most important is that regulatory agencies such as the FDA often require rigorous handling of missing data in clinical trials to ensure the validity of study results. This blog post will walk through the various facets of missing data, understanding the types of missingness, and exploring the fundamental techniques of data imputation.
Missingness Types, Definitions, and Examples
1. Missing Completely at Random (MCAR)
Imagine participants in a survey, diligently filling out forms. Suddenly, an unforeseen event occurs where a cup of coffee is spilled, causing parts of the forms to be corrupted. This is a classic example of MCAR, where the missingness occurs purely by chance and is independent of any study outcome. While analyzing the remaining data won’t lead to biased results, it introduces a heightened level of uncertainty due to data scarcity.
2. Missing at Random (MAR)
MAR hinges on observed variables, but not on any observed ones. For instance, in the same survey, individuals with higher incomes might be less inclined to disclose their earnings. However, once you factor in variables like age and education level (which are observable), the missingness becomes independent of the unobserved data. Understanding MAR requires an astute consideration of these auxiliary variables that can shed light on the missing data.
3. Missing Not at Random (MNAR)
MNAR is a different beast altogether and can be more challenging compared to MCAR or MAR data. It emerges when the missing data follows a systematic pattern that can’t be explained by the measured or observed variables. Picture an industrial scale that malfunctions more frequently when tasked with weighing heavy loads. The missingness here is intrinsically tied to the weight itself, a clear instance of MNAR.
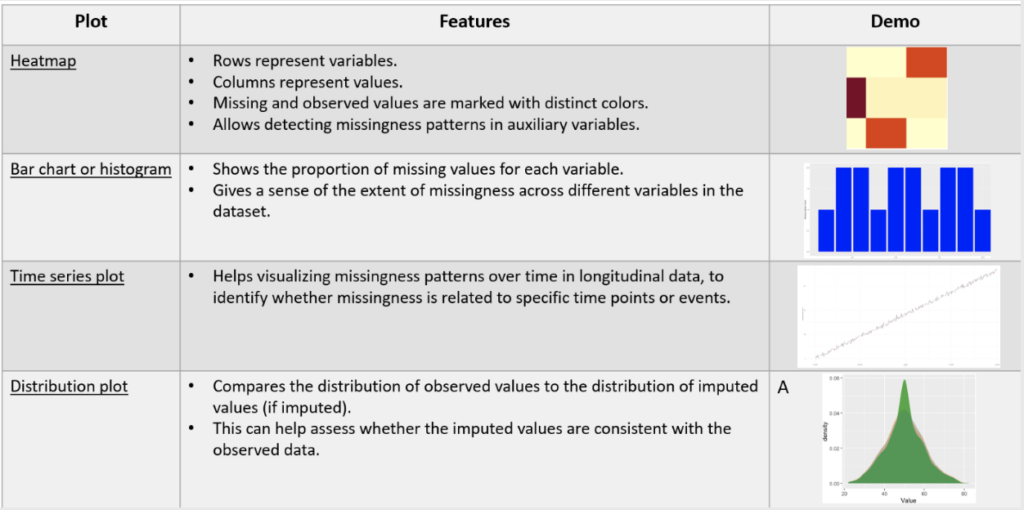
Visualization of Missingness
The following table is a partial list of popular chart types used to visualize missingness in the data, with the aim of characterizing the missingness mechanism and suggesting potential remedies.
Utilizing a heatmap helps point to auxiliary variables under the assumption of MAR missingness. The bar chart provides a quick assessment of the magnitude of the missingness issue in each variable, while the time series plots address missingness in longitudinal data and whether it exacerbates over time, and the distribution plot is used as a diagnostic tool to appraise the MAR assumptions made by the analyst.
Strategies for Tackling Missing Data
MCAR
Complete Case Analysis (Listwise deletion): This approach entails analyzing only those cases where there are no missing values in the variables of interest. It offers unbiased estimates, variance, and regression coefficients, but comes at the cost of lost information and potential bias if the data isn’t truly MCAR.
Available Case Analysis (Pairwise deletion): Here, missing values are ignored in specific analyses, leading to varying sample sizes for different variables. While it provides unbiased estimates of means and covariances, it introduces increased variability, information loss, and potential bias if the data isn’t truly MCAR.
Mean Imputation: This includes a quick fix involving imputing the missing values by the mean (or mode for categorical data). This approach is fast, simple, and keeps the sample size preserved. It is often useful for low missingness rates. However, it can be biased, is often found to underestimate variance, and should generally be avoided.
MAR
Regression Imputation: This technique involves estimating missing values based on a regression model fitted to observed data. It’s a powerful tool but can inadvertently strengthen spurious relations and struggle with outliers.
Stochastic Imputation: A refined version of regression imputation, it accounts for randomness in imputed values. While it can handle imputation uncertainty, it comes with computational complexities and is not good for a dataset with minimal missing data.
MNAR
Handling MNAR data is akin to navigating uncharted waters. Since obvious regressors aren’t readily available, understanding the missingness mechanism demands a meticulous exploration of the data. Collecting auxiliary information, if possible, is paramount, and transparency in reporting findings, including the imputation model and assumptions, is crucial.
Navigating Multiple Imputations Under MAR
When the data aligns with the MAR assumption, a model for the variable containing the missingness can be crafted based on auxiliary variables. Rather than a single predicted value, multiple imputed datasets are generated, introducing a layer of uncertainty. This approach, while more complex, yields unbiased population-level estimates and ensures type I error rate control in hypothesis testing.
Methods and Software Packages for Missing Data Handling
The following list comprises of five R (open source) libraries and three additional software packages available from commercial vendors, all used for the purpose of handling missing data. The various R libraries used for imputation may differ by their underlying modelling assumptions. Particularly in R, the user can handily run multiple methods and test the stability of their results.

Unpacking Longitudinal Data Imputation
In the realm of longitudinal data, four key methods emerge:
- Last Observation Carried Forward (LOCF): This involves carrying forward the last observed value. While straightforward in application, it can fall short in certain scenarios and has been shown to perform poorly in various studies.
- Linear Interpolation: This technique estimates missing values by assuming a linear relationship between adjacent observed values. However, it’s suitable only when the missing data follows a linear trend.
- Time Series Modelling: Complex but powerful, it captures temporal dependencies in the data. However, it requires certain assumptions about the data’s behavior.
- Multiple Imputation: This versatile approach generates multiple imputed datasets, each with different plausible imputed values. While flexible, it comes with computational costs.
Recommendations and Caveats for Multiple Imputation
Selecting the number of imputations hinges on the complexity of the data. While a large number of imputations (e.g., 200) might be suitable for highly variable quantities (such as variance components), a more moderate range (e.g., m=5-20) suffices for moderate missingness. However, it’s crucial to exercise caution with multiple imputations, particularly in scenarios involving small datasets, high missingness rates, and complex data structures.
Conclusion
Navigating missing data in clinical trials is a nuanced endeavor. It requires a keen understanding of the types of missingness and a strategic approach to data imputation. Each type of missingness demands tailored strategies, and multiple imputations, under the right conditions, can be a potent tool. Careful consideration, transparency, and adherence to best practices are paramount in addressing missing data in clinical trials. As we navigate the landscape of clinical research, these insights serve as a compass, guiding us toward more accurate and reliable results.